使用python进行科研绘图入门--突出重点
摘要
python绘图技巧备忘录
使用Matplotlib,以代码呈现为主
标注,局部放大
1. 图中文本标注
1.1 plt.text()
1 | plt.text(x,y,'string',ha = 'center',va = 'bottom',fontsize=7)#加标签 |
1 | x,y:表示坐标值上的值 |
1.2 plt.annotate()
1 | plt.annotate("(3, 6)", |
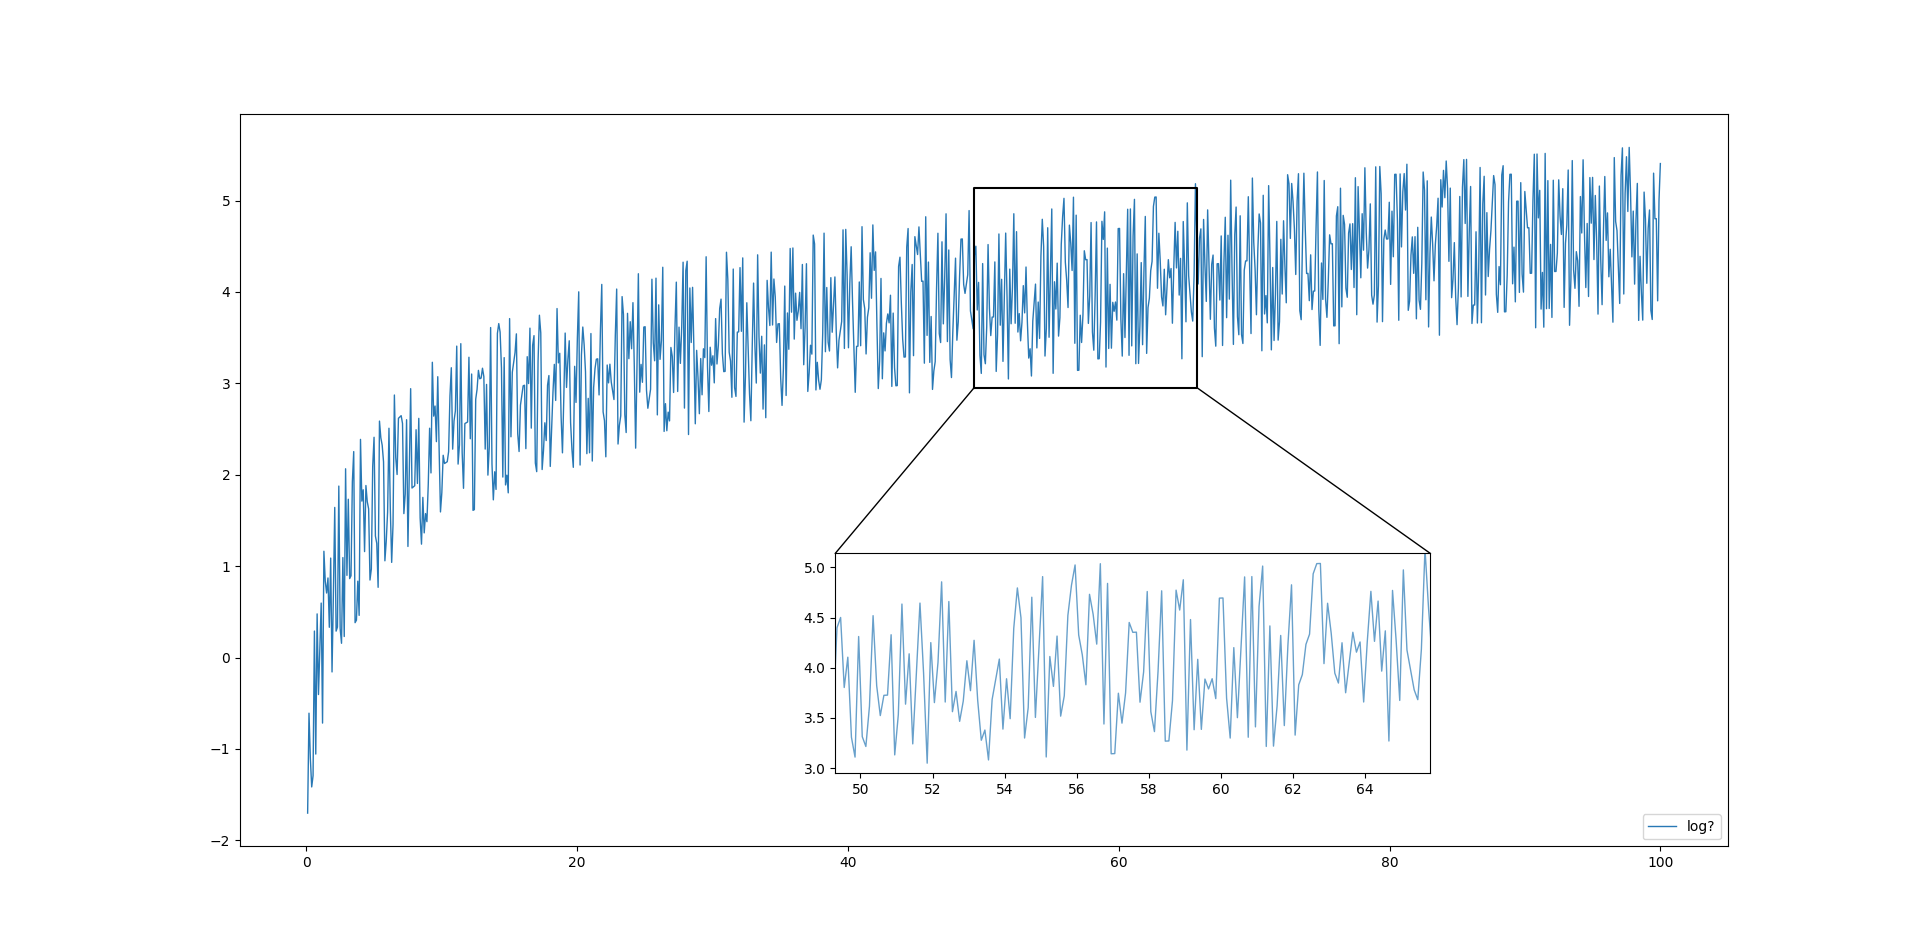
2. 局部放大
该函数代码转载自
https://blog.csdn.net/weixin_45826022/article/details/113486448
1
2
3
4
5
6
7
8
9
10
11
12
13
14
15
16
17
18
19
20
21
22
23
24
25
26
27
28
29
30
31
32
33
34
35
36
37
38
39
40
41
42
43
44
45def zone_and_linked(ax,axins,zone_left,zone_right,x,y,linked='bottom',
x_ratio=0.05,y_ratio=0.05):
"""缩放内嵌图形,并且进行连线
ax: 调用plt.subplots返回的画布。例如: fig,ax = plt.subplots(1,1)
axins: 内嵌图的画布。 例如 axins = ax.inset_axes((0.4,0.1,0.4,0.3))
zone_left: 要放大区域的横坐标左端点
zone_right: 要放大区域的横坐标右端点
x: X轴标签
y: 列表,所有y值
linked: 进行连线的位置,{'bottom','top','left','right'}
x_ratio: X轴缩放比例
y_ratio: Y轴缩放比例
"""
xlim_left = x[zone_left]-(x[zone_right]-x[zone_left])*x_ratio
xlim_right = x[zone_right]+(x[zone_right]-x[zone_left])*x_ratio
y_data = np.hstack([yi[zone_left:zone_right] for yi in y])
ylim_bottom = np.min(y_data)-(np.max(y_data)-np.min(y_data))*y_ratio
ylim_top = np.max(y_data)+(np.max(y_data)-np.min(y_data))*y_ratio
axins.set_xlim(xlim_left, xlim_right)
axins.set_ylim(ylim_bottom, ylim_top)
ax.plot([xlim_left,xlim_right,xlim_right,xlim_left,xlim_left],
[ylim_bottom,ylim_bottom,ylim_top,ylim_top,ylim_bottom],"black")
if linked == 'bottom':
xyA_1, xyB_1 = (xlim_left,ylim_top), (xlim_left,ylim_bottom)
xyA_2, xyB_2 = (xlim_right,ylim_top), (xlim_right,ylim_bottom)
elif linked == 'top':
xyA_1, xyB_1 = (xlim_left,ylim_bottom), (xlim_left,ylim_top)
xyA_2, xyB_2 = (xlim_right,ylim_bottom), (xlim_right,ylim_top)
elif linked == 'left':
xyA_1, xyB_1 = (xlim_right,ylim_top), (xlim_left,ylim_top)
xyA_2, xyB_2 = (xlim_right,ylim_bottom), (xlim_left,ylim_bottom)
elif linked == 'right':
xyA_1, xyB_1 = (xlim_left,ylim_top), (xlim_right,ylim_top)
xyA_2, xyB_2 = (xlim_left,ylim_bottom), (xlim_right,ylim_bottom)
con = ConnectionPatch(xyA=xyA_1,xyB=xyB_1,coordsA="data",
coordsB="data",axesA=axins,axesB=ax)
axins.add_artist(con)
con = ConnectionPatch(xyA=xyA_2,xyB=xyB_2,coordsA="data",
coordsB="data",axesA=axins,axesB=ax)
axins.add_artist(con)1
2
3
4
5
6
7
8
9
10
11
12
13
14
15
16
17
18
19
20
21
22
23
24
25import matplotlib.pyplot as plt
from matplotlib.patches import ConnectionPatch
import numpy as np
# 模拟数据
x = np.linspace(0, 100, 1000)
y = np.log(x)
Perturbations = np.random.randint(-10,10,1000)
y -= Perturbations/10
# 绘制主图
fig, ax = plt.subplots(1, 1)
ax.plot(x,y,color="#2878b5", linewidth=1.0, linestyle="-",label = 'log?')
ax.legend(loc="lower right")
# 绘制缩放图
axins = ax.inset_axes((0.4, 0.1, 0.4, 0.3))
# (x0, y0, width, height)以父坐标系中的x0=0.2*x,y0=0.2*y为左下角起点,
# 嵌入一个宽度为0.2*x,高度为0.3*y的子坐标系,其中x和y分别为父坐标系的坐标轴范围。
axins.plot(x,y,color="#2878b5", linewidth=1.0, linestyle="-",alpha=0.7)
zone_and_linked(ax, axins, 500, 650, x , [y], 'bottom')
plt.show()
参考资料
[1] Python 绘图,我只用 Matplotlib(二)
[2] Python 绘制局部放大图