摘要
python绘图技巧备忘录
使用Matplotlib,以代码呈现为主
入门,配色,坐标轴修改
1.安装
2.基本绘图
以线图为例
1
2
3
| import matplotlib.pyplot as plt
plt.plot(x,y,format_string,**kwargs)
|
1
2
3
4
5
6
7
8
9
10
11
12
13
14
15
16
17
18
19
20
21
22
23
24
25
26
27
28
29
30
| 风格 linestyle
'-' 实线
'--' 破折线
'-.' 点划线
':' 虚线
标记 marker
'.' point marker
',' pixel marker
'o' circle marker
'v' triangle_down marker
'^' triangle_up marker
'<' triangle_left marker
'>' triangle_right marker
'1' tri_down marker
'2' tri_up marker
'3' tri_left marker
'4' tri_right marker
's' square marker
'p' pentagon marker
'*' star marker
'h' hexagon1 marker
'H' hexagon2 marker
'+' plus marker
'x' x marker
'D' diamond marker
'd' thin_diamond marker
'|' vline marker
'_' hline marker
|
2.2 颜色参照表
修改plt中的color属性
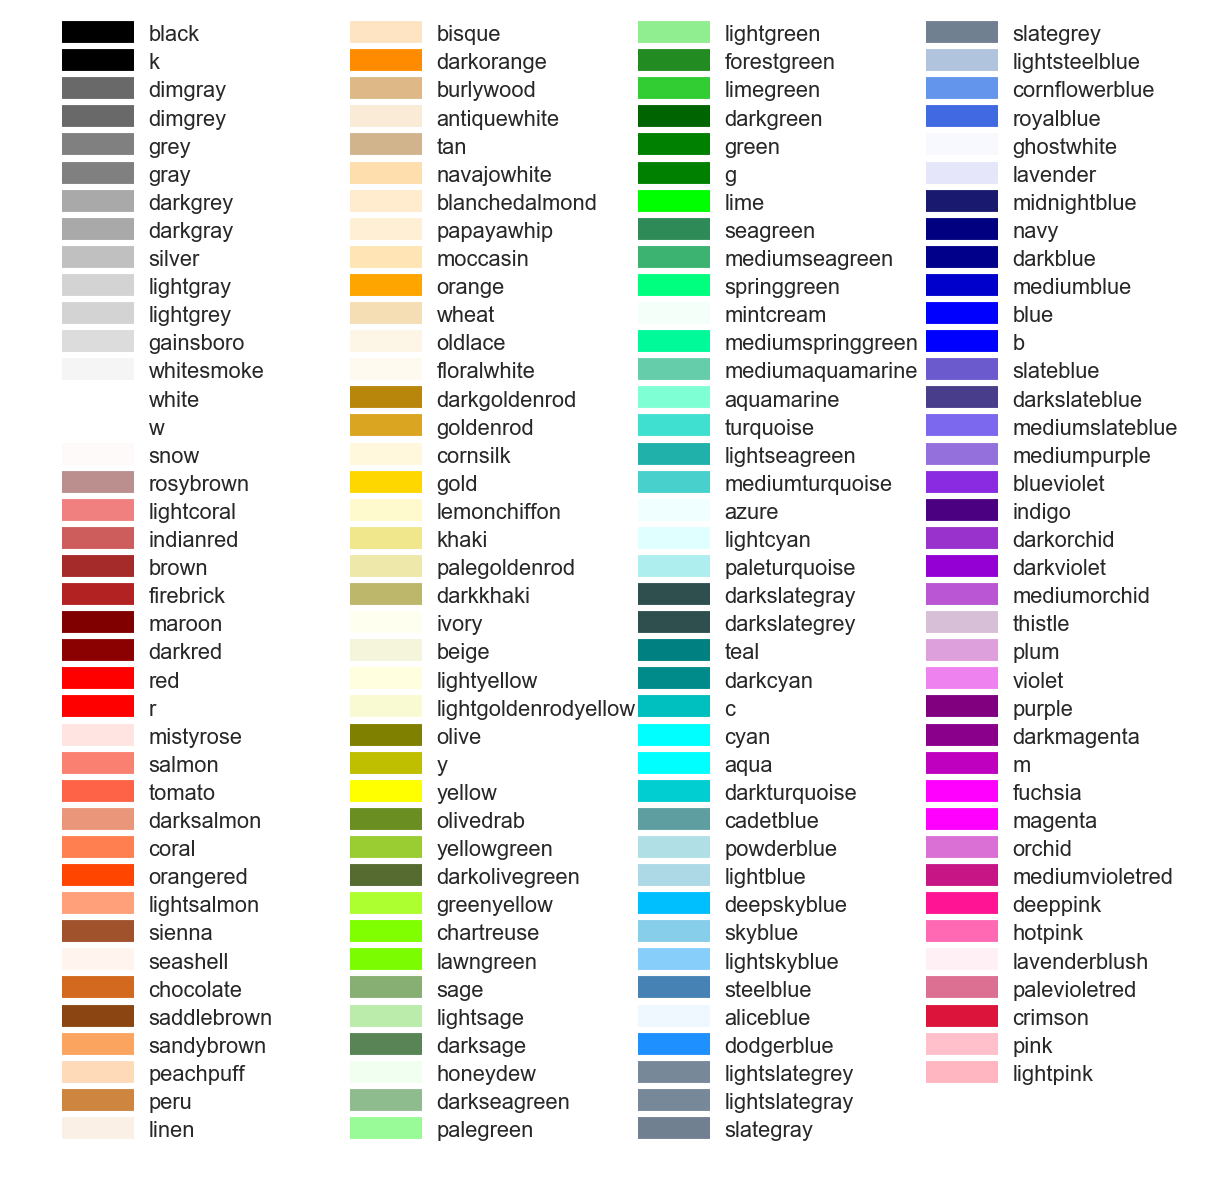 颜色参照表
颜色参照表
科研级配色参考
- 蓝红4色
1
2
3
4
5
| #2878b5
#9ac9db
#f8ac8c
#c82423
#ff8884
|
- 浅粉紫
1
2
3
4
5
6
7
8
| #A1A9D0
#F0988C
#B883D4
#9E9E9E
#CFEAF1
#C4A5DE
#F6CAE5
#96CCCB
|
2.3 调用方法
1
2
3
4
5
6
7
8
9
10
11
| import matplotlib.pyplot as plt
import numpy as np
# 创建一个点数为 8 x 6 的窗口, 并设置分辨率为 80像素/每英寸
plt.figure(figsize=(8, 6), dpi=80)
x = np.linspace(-np.pi, np.pi, 100)
y = np.sin(x)
plt.plot(x,y,color="#2878b5", linewidth=1.0, linestyle="-", marker = 'o')
plt.show()
|
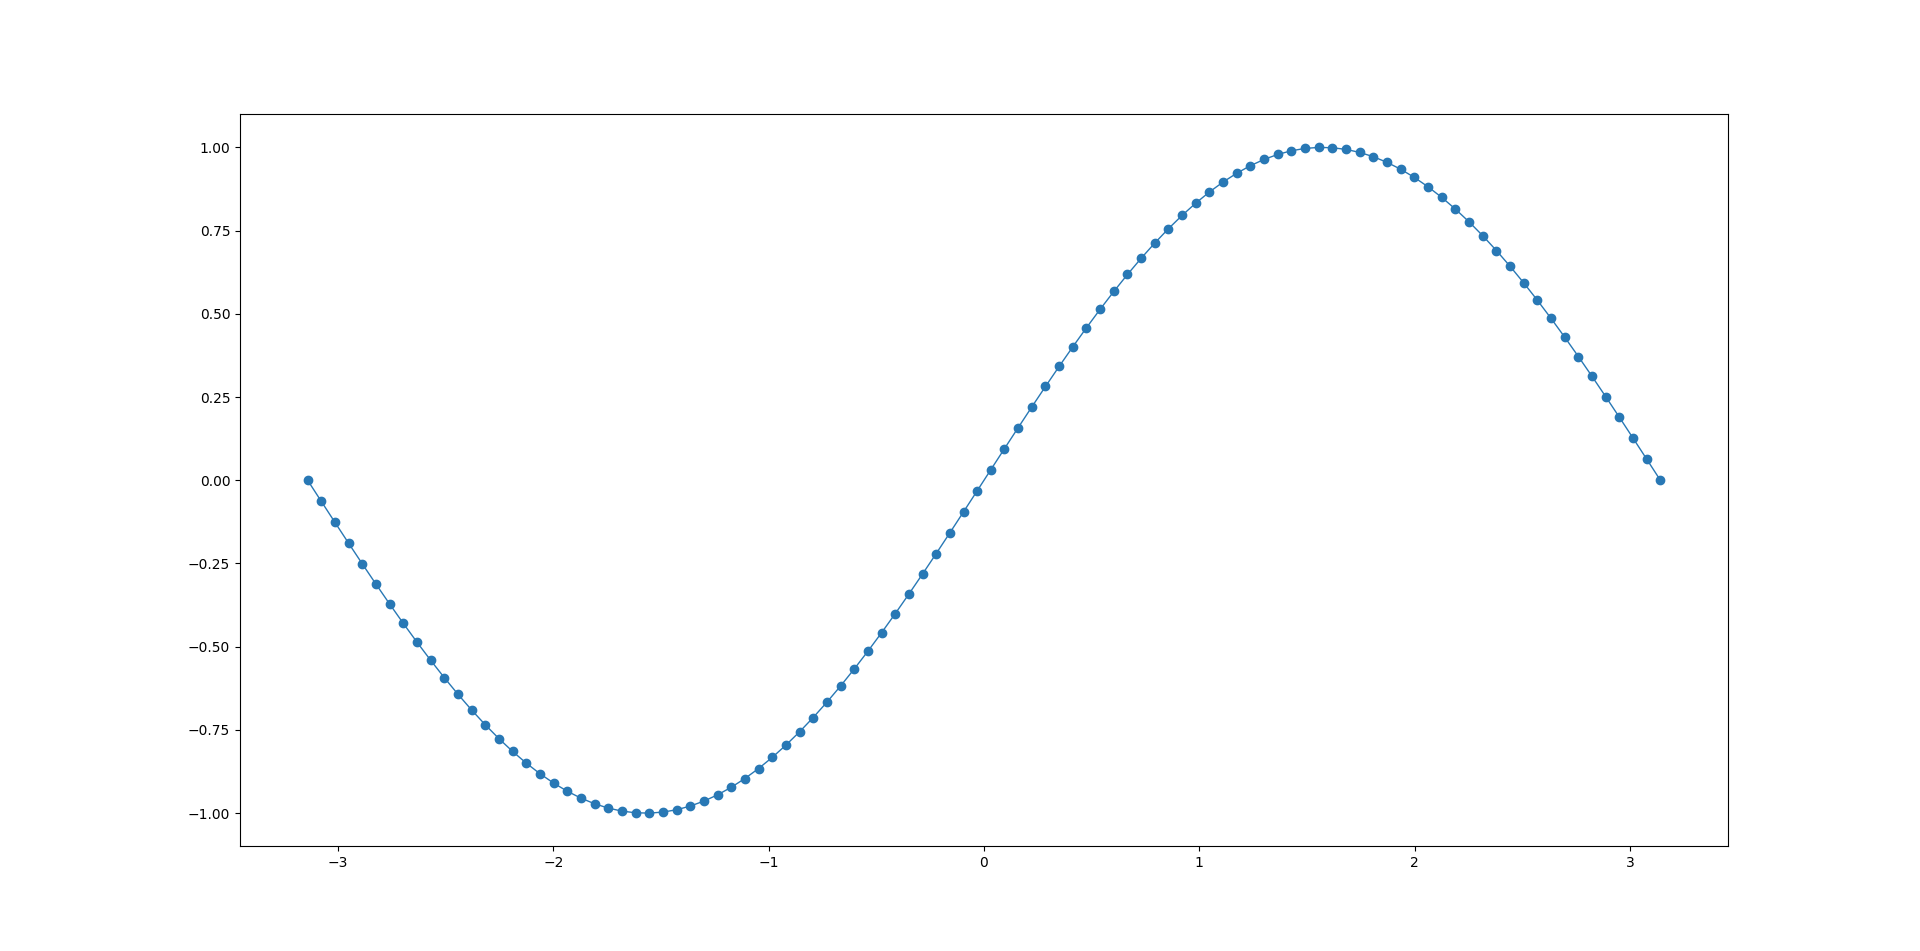 测试
测试
3.坐标修改
3.1 修改横纵坐标标签
1
2
| plt.xlabel('wavenumber$(\mathit{ cm^{-1}})$',fontdict={'family' : 'Times New Roman', 'size' : 29})
plt.ylabel('intensity(arb.units)',fontdict={'family' : 'Times New Roman', 'size' : 29})
|
3.2 修改横纵坐标刻度
1
2
| plt.yticks(fontproperties = 'Times New Roman', size = 23)
plt.xticks(fontproperties = 'Times New Roman', size = 23)
|
3.3 网格与标签
1
2
3
4
5
6
| ax=plt.gca()
ax.xaxis.set_major_locator(x_major_locator) #画刻度
plt.xlim(0,120) #设置上下限
plt.grid(axis='x',linestyle='-.') #画竖线
#plt.text(100,80,'atm',ha = 'center',va = 'bottom',fontsize=7)#加标签
#ax.set_yticks([]) #隐藏y轴刻度
|
3.4 图例
1
2
| plt.plot(x,y,label="y1")
plt.legend(loc="upper left")
|
1
2
3
4
5
| upper left 左上
upper right 右上
upper left左上
lower right右下
lower left左下
|
参考资料
[1] https://www.cnblogs.com/darkknightzh/p/6117528.html
[2] https://zhuanlan.zhihu.com/p/47588077